Failures and logs
What Fadenstack repairs by itself when part of a cluster fails, what you see while it does, what is left to you, and where to read the logs when you need them.
What repairs itself
Every minute, Fadenstack looks at each running cluster and each serving model, and again when a machine reconnects or the server starts. A look restarts nothing unless something is wrong, and it looks a second time before it restarts anything: a busy head that was slow to answer is not a dead one.
| What fails | What you see | What Fadenstack does |
|---|---|---|
| A model copy crashes | The deployment reads fewer copies, then all again | Nothing: Ray restarts the copy |
| Ray stops on a machine that is not the head, or its network link goes down | The cluster reads Needs attention: "machine has dropped out of the cluster" | Takes the machine out of Ray and joins it again, once it can. Copies on the other machines keep serving |
| Ray's head stops | Needs attention: "Ray on machine, the cluster's head, is not running. Checking again before restarting anything", then "Restarting the cluster (attempt 1 of 3)" | Stops Ray everywhere, starts a new head, joins the other machines, applies the models again |
| The head machine reboots | The machine reads Offline, then as above once it is back | As above |
| A machine's agent restarts | Nothing | Looks at the cluster, finds it healthy, restarts nothing |
| The server's services restart, or the server is upgraded | Nothing on the clusters | Waits for the machines to reconnect, then looks. Nothing is restarted or applied again |
| The gateway restarts | Chat and API requests fail while it is down | Nothing needed |
| The connection between a machine and the server drops | The machine reads Offline if it stays away | What the machine was doing, such as copying a model, carries on; the result is reported when it reconnects |
Most of an outage after a head failure is the models loading again; the cluster itself is back much sooner.
While a cluster is restarted, its models read Not serving and the gateway stops sending them requests. Nothing is applied to a cluster that is not ready, and nothing is applied while one of its machines is offline: the model says "Waiting for machine to reconnect before applying." and goes ahead once it has.
When it cannot repair it
After three restarts that did not bring the head back, the cluster reads Failed:
Ray on machine, the cluster's head, is not running. Fadenstack restarted it 3 times and it did not come back (last: …). It tries again every 15 minutes; use Try again once the cause is fixed.
It keeps trying every 15 minutes, because the cause may go away without anyone telling Fadenstack, such as a network link that comes back. Fix the cause, then select Try again on the cluster's page.
It does not restart anything when nobody answered its look: then nothing is known about Ray, and the model says "Could not check the model just now; it is looked at again within a minute."
What is left to you
- A machine that does not come back: a dead disk, a driver that broke, a cable. Repair it, or remove it from the cluster.
- A cause that comes back on every attempt. Fadenstack stops retrying it and says so (below).
- The server itself: disk space, certificates, backups. The dashboard's Needs attention list shows what is wrong.
What the deployment messages mean
A deployment's page says in one line what it is doing. The ones you will meet:
| Message | What it means | What to do |
|---|---|---|
| Downloading model to the Fadenstack server (…%). It is copied to the cluster as soon as it is there. | The server is fetching the model first | Wait; or download it ahead of time in the model marketplace |
| Downloading model to the Fadenstack server failed: … | A gated model without a token, a mistyped repository | Fix it, then retry the download under Model marketplace → On this server |
| Copying the model to the machines again after a failed attempt. | A copy to a machine failed and is retried | Wait; if it keeps failing, check the machine's disk |
| Serving on 1 of 2 copies; 1 more starting. | Some copies are up, the rest are loading | Wait |
| Serving on 2 of 3 copies. 1 cannot start: each copy needs 1 accelerator, and this cluster has 2, so 2 fit. Scale to 2, or add a machine to the cluster. | More copies were asked for than the cluster has room for | Scale down, or add a machine |
| Waiting for machine to reconnect before applying. | A machine of the cluster is offline | Bring the machine back |
| The cluster was restarted: applying the model again; its copies are starting. | The cluster was repaired; the model loads again | Wait |
| A start failed: … Ray is trying again. | The engine failed to start; the reason is its own | Read the reason; if it is a setting, change it |
| Start failed: … Not tried again: this error comes back on every attempt. | The deployment reads Failed and stops retrying | Change what the reason names (for example the engine settings), and it is applied again |
| Port … is already in use on this machine by another program; publish this model on another port. | The model's port is taken on the machine | Free the port, or publish the model on another |
The most common start failures are a model that does not fit in the GPU's memory, and a number format the card does not support. Changing a deployment's settings is the administrator's work: see Deployments. Show the errors on a failed deployment opens its log at the errors.
Reading the logs
In the console
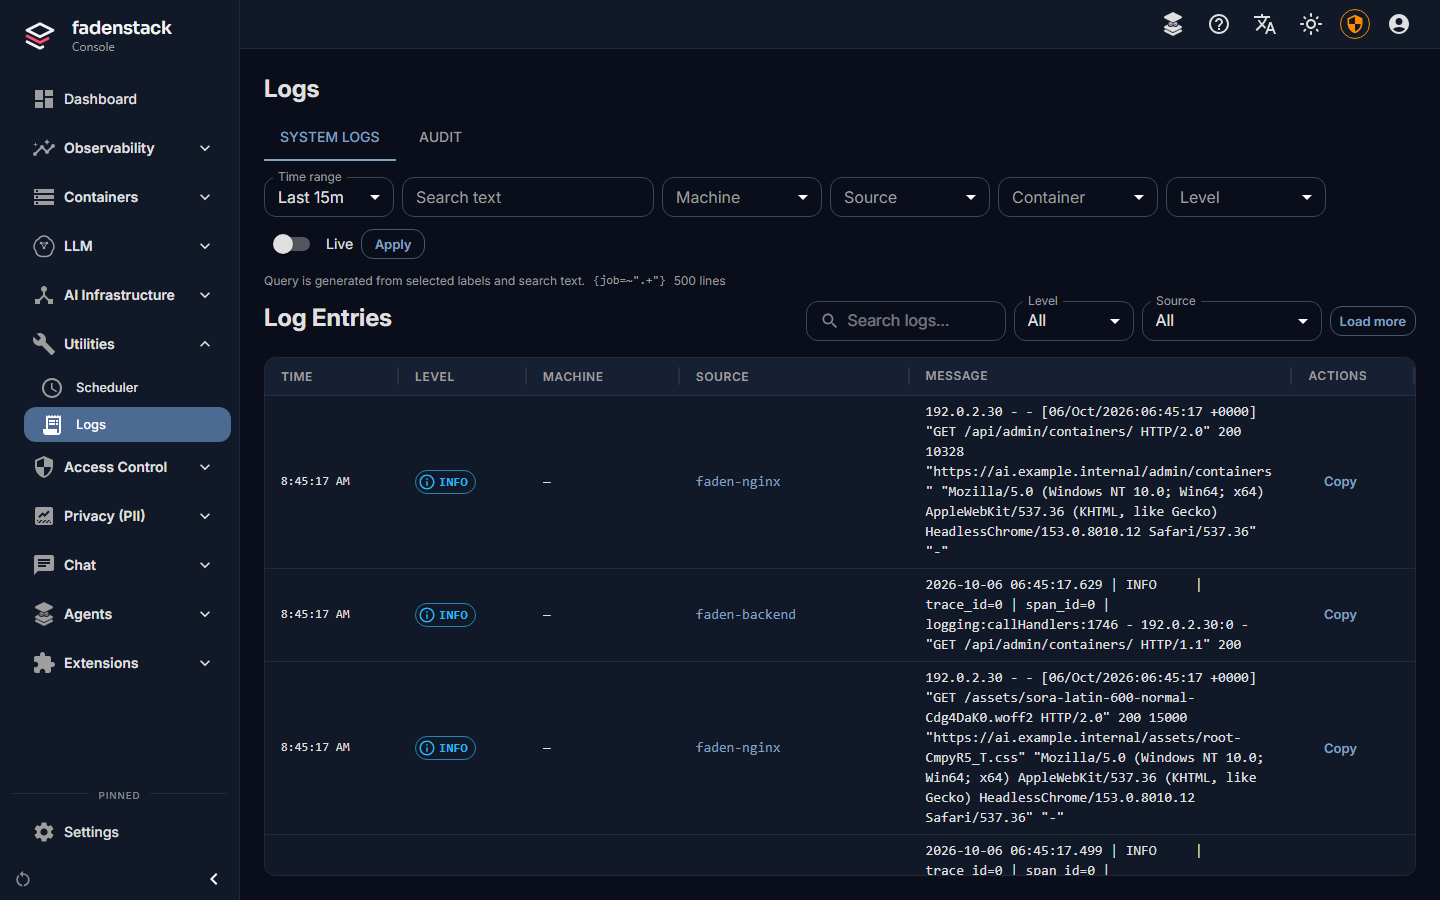
Logs (in the navigation) collects the logs of every machine and of the server's own services. On the System Logs tab:
- choose a time range (Last 15m to Last 24h, or Custom), or select Live to follow new lines;
- narrow by Machine, Source, Deployment, Component, Copy, Service, Container and Level. The filters only offer what the chosen time range contains;
- search the text.
| Source | What it is |
|---|---|
| System log | A machine's own system journal: every service on it, the agent included |
| Model serving | The model copies on a cluster. Deployment and Component narrow it to one model |
| Fadenstack services | The server's own containers |
| Model containers | Models run one container per model, outside a cluster |
The Audit tab lists who changed what: the action, its target, its result and who did it.
Other places in the console show the same logs where you need them:
- a machine's page: its System Logs of the last 15 minutes, and Open in Logs for the rest;
- a deployment's page: its Logs, with the model serving and the engine (vLLM) lines, filtered by level, searchable, and with Follow new lines, Copy the lines shown and Download the lines shown;
- a container's page under Containers: its last 300 lines.
The model copies write a line when something happens (starting, stopping, an error), not for every request.
Machines send their logs through the server's normal address, with their own credential; a line the server did not take is sent again later. Nothing has to be set up on the machines.
Metrics dashboards are in Grafana, reached from the console at /grafana/ (a cluster's page has Open the
metrics dashboard).
On the server
faden status                          # which services run, and which are unhealthy
faden logs faden-backend              # the last 100 lines of one service
faden logs -f -n 200 faden-gateway    # follow it
faden logs --timestamps nginx postgres
Service names are those in faden status: faden-backend, faden-backend-worker, faden-gateway,
faden-frontend, nginx, postgres and so on. The scheduled jobs log to ~/fadenstack/backups/backup.log
(backups) and ~/fadenstack/logs/tls-renew.log (certificate renewal).
On a machine
faden-agent status
journalctl -u faden-agent -f            # a system service
journalctl --user -u faden-agent -f     # a user service
faden-agent run runs the agent in the foreground, which shows at once why it does not connect. Stop the service
first.