The dashboard
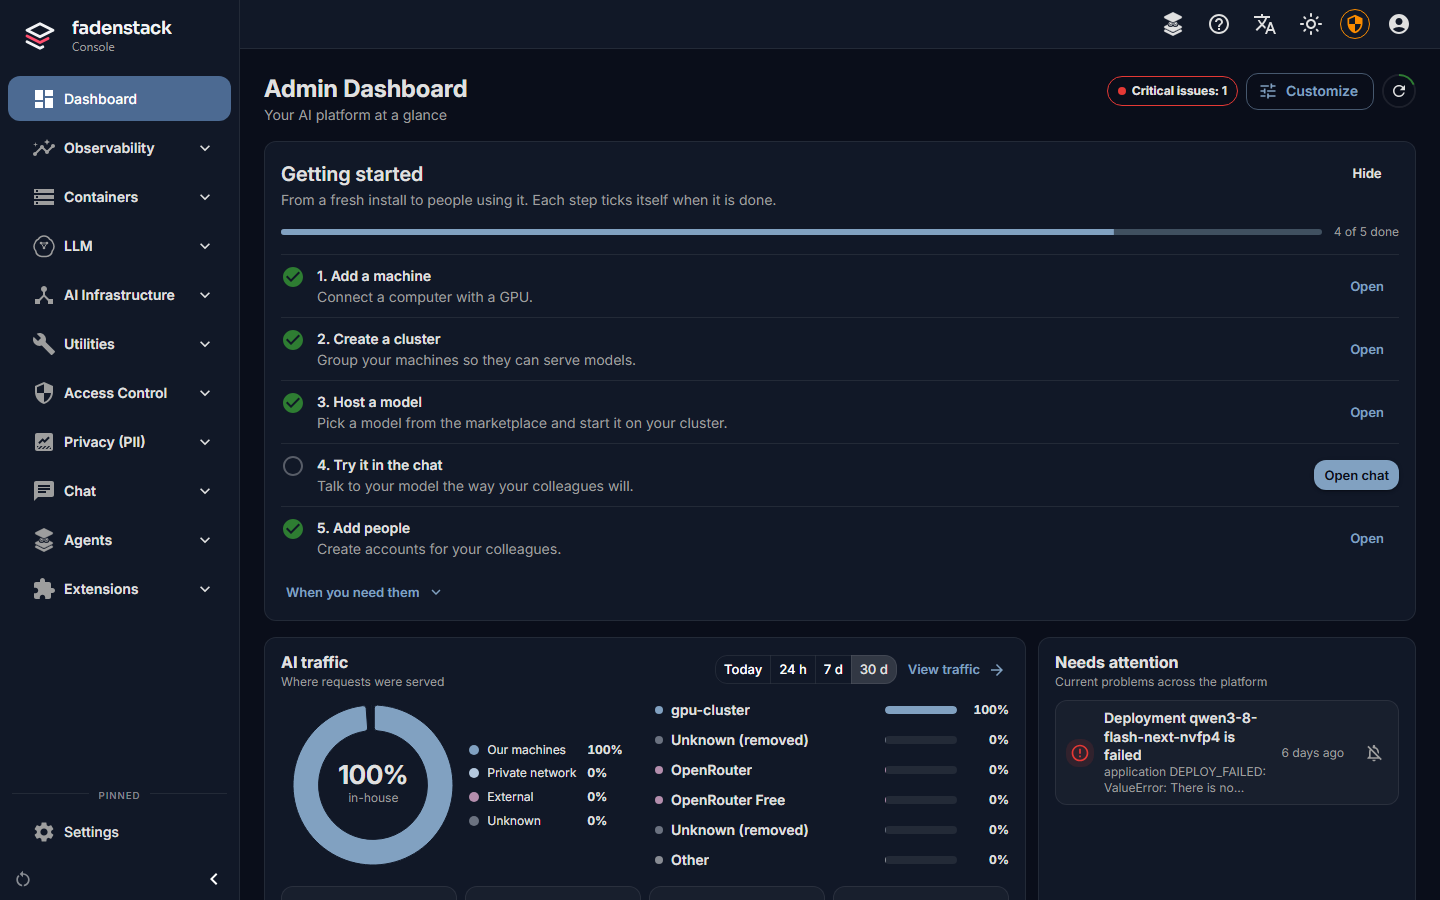
Dashboard, the first entry of the console, shows the whole system on one page: what needs your attention, how much it is used and where requests were served, how busy the GPU machines are, and the health of the server Fadenstack runs on. This page says what each part shows and what to do about it.
Before you start
- You are a Superuser: only superusers see the dashboard.
The header
- The status pill sums up the system: System healthy, Warnings: N or Critical issues: N. It counts what Needs attention lists.
- The ring beside it shows when the figures were last updated. They refresh every 30 seconds while the tab is open, and pause in a hidden tab. Select the ring to refresh at once. It turns amber, then red, when a refresh is late or failed; the figures shown are then the previous ones.
- Getting started sits above the cards until you hide it (see Administering Fadenstack).
What each card shows
Each card loads and refreshes on its own. A card that cannot load says "This widget could not load." with Retry, and the others carry on.
| Card | What it shows | What to do with it |
|---|---|---|
| Key metrics | Up to six figures you choose, each with its trend (below). | Pick the ones you watch with the sliders icon. |
| AI traffic | Where requests were served, with the in-house share in the middle of the ring, the busiest destinations, the number of requests, their speed (P50, P95) and errors, for Today, 24 h, 7 d or 30 d. | View traffic opens the cost and usage pages. |
| Needs attention | Current problems, worst first (below). | Fix them, or mute what you already know about. |
| Local AI capacity | Clusters healthy, machines online, GPUs and free GPUs, and each machine's CPU, GPU and VRAM. Colour by: Health, GPU or VRAM. | Select a machine or group for details; Machines opens the machines. |
| Usage | Requests per day for the last 7 days or 30 days, by where they were served. | See Usage and costs. |
| Integrations | LLM providers by where they run and how many answer, MCP servers healthy, Skills active. | Each opens its page. |
| Platform health | The overall state, the services Fadenstack depends on (database, message queue, Grafana), the modules, gateway errors in the last hour, and database connections in use. | A dependency that is down appears under Needs attention too. |
| Server resources | CPU, memory, swap, disk and GPU of the server Fadenstack runs on. | Low disk appears under Needs attention. |
| Top containers | The containers using the most CPU and memory. Hidden at first. | Containers opens them. |
| Grafana | The Grafana overview dashboard. Hidden at first. |
Where requests were served
AI traffic, Usage, Integrations and Kept in-house use four classes: Our machines (your GPU machines and this server), Private network, External (a cloud provider) and Unknown (where it cannot be told, such as a provider since removed). In-house is our machines plus the private network. A request refused before it reached any model is counted apart ("Rejected before routing"). The classes are the same as on the Data residency page.
Machine health
A machine's health is what the machine reports, never how busy it is: a GPU at 100 % on a healthy machine is healthy. VRAM reads as allocated: a running model reserves most of its accelerator's memory by design. With many machines, the card draws a small cell per machine, then a summary per group; select a group to list its machines.
Key metrics
| Metric | Shows | Compared with |
|---|---|---|
| Requests today | Requests and tokens | Yesterday at this time |
| Active users today | People today, and this month | Yesterday at this time |
| Kept in-house | The share of requests served on your machines or private network | Yesterday at this time |
| Spend this month | Estimated from model prices; how many requests to external models had no price | Last month up to the same day |
| Needs attention | Open problems, critical and warning | |
| Error rate (1 h) | Gateway errors, and the P95 response time | The hour before |
| GPUs in use | GPUs at 10 % utilization or more, and machines online |
A trend's colour says whether the change is good or bad, not whether it went up: more errors is red, a larger in-house share is green. Times follow your browser's time zone.
Needs attention
| Problem | What to do |
|---|---|
| A machine is offline, stopped reporting or reports a bad state | Its agent is not connected or not sending. Check the machine (see GPU machines). |
| Machines waiting to join | Approve or reject them under AI Infrastructure → Machines. |
| A GPU's temperature is high | Check the machine's cooling and airflow. |
| A cluster is degraded or failed | Open the cluster for the reason (see Clusters). |
| A deployment is failed or degraded | Open it and read its message and log (see Deployments). |
| A provider is not answering | Requests are not sent to it until it answers. Check the provider (see Remote providers). |
| Model downloads failed | Retry under Model marketplace → On this server. |
| Tool changes waiting for an agent | Review them on the agent's Apps tab (see Agents and add-ins). |
| Gateway server errors | Many requests fail. Read the logs (see Failures and logs). |
| A dependency is down, Disk space low, Containers restarting | A problem with the server itself: see Troubleshooting. |
| Document ingestion failed | Retry the documents in the knowledge base. |
| An MCP server is in error | Its tools are not available to chats. Open it and select Test (see MCP servers). |
| An HTTPS or model certificate runs out soon, or ran out | See HTTPS and trust. |
| Model traffic to a cluster is not encrypted | Turn on encryption on the cluster's page; its models load again (see Clusters). |
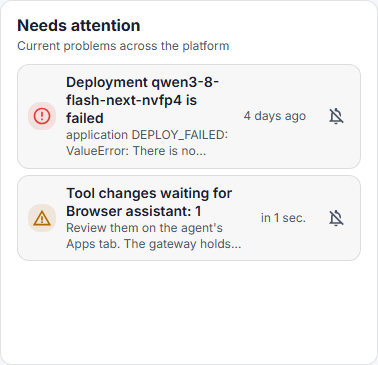
Mute (the bell beside a problem) mutes it for every administrator. A muted problem moves under N muted at the end of the list, and leaves the header's count; the list says who muted it and when. Show again brings it back. A mute lasts while the problem does: once it clears, the mute is dropped, so the same problem coming back is shown as new. A muted problem that gets worse, such as a warning turning critical, is shown again.
Arrange it
- Select Customize.
- Drag a card by its handle to move it, pick its size (Small, Medium, Large or Full width), and hide or show it with the eye. Rows close up around a hidden card.
- Select Done. Reset layout goes back to the default.
Your layout is saved on the server for you, so it follows you to another browser or device. If you change it on two devices at once, the second save says "Your layout was changed on another device": Keep mine overwrites the other, OK takes it. On a phone, the cards stack in one column.