Usage and costs
Fadenstack counts every request that goes through its gateway: who sent it, which model answered and where it ran, how many tokens it took, how long it took, and what it would cost at the prices you set. This page shows where to see those figures, and how to make the cost estimates meaningful.
What is counted
For each request, the request log keeps:
- the person, their Usage group, and the chat project or the agent it came from;
- the model, and where it ran: on your machines, in your network or at an external provider;
- the tokens: prompt, completion and total;
- the time to the first token and the whole time;
- the outcome: success or the error;
- the estimated cost, when the model has a price.
The text of the request and its answer is not part of it. Everything that goes through the gateway is counted: the chat, the agents, and applications using API tokens.
Where to see it
| Where | What it shows |
|---|---|
| Dashboard | Today at a glance: Requests today, Active users today, Kept in-house, Spend this month, Error rate (1 h); AI traffic (where requests were served) and Usage (requests per day, by where they were served). |
| Observability → Cost Dashboard | The cost and usage pages (below). |
| An agent's Activity tab | Requests, errors, tokens, users and conversations of that agent, counts only (see Agents and add-ins). |
| A deployment's page | Requests, speed and failures of that model over the last minutes (see Deployments). |
| Observability → Data Residency | How much data went to your machines, your network and outside (see Data residency). |
The cost and usage pages
Open Observability → Cost Dashboard (the page is titled Cost Observability) and pick a time range.

- Overview: Estimated Spend, Total Requests, Total Tokens, Avg Latency and Error Rate, with Cost Over Time, Request Throughput, Latency Percentiles, Spend by Model and Top Users.
- Requests: every request, newest first. Filter by Model or User ID, and open one for its details: tokens, cost, timing, the tools and skills it used, and the steps it went through.
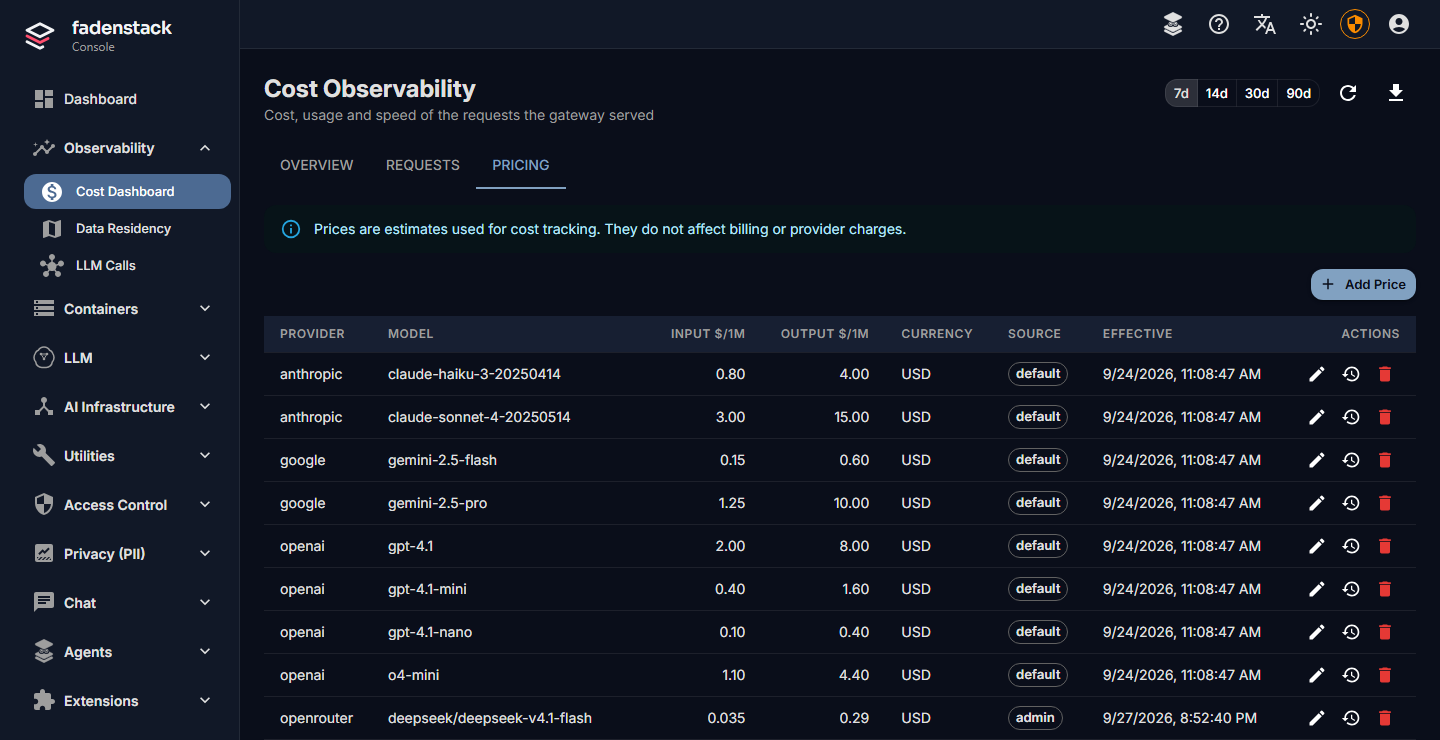
- Pricing: the prices the estimates use (below).
- Export CSV downloads the requests of the range (up to 5,000 rows) for a spreadsheet.
Set prices
Costs are estimates from prices you set per model. They do not change what a provider bills you.
- Open LLM → Providers and select Set price in the model's row (in the Price $/1M column).
-
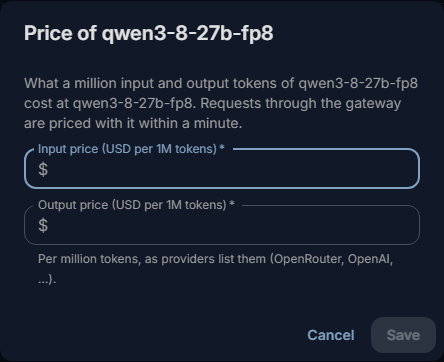
Enter what a million input tokens and a million output tokens cost.
-
Save. Requests are priced with it within a minute.
You can also set prices when you connect a provider, or under Pricing on the cost pages, where each model's price history is kept. Use the provider's list prices for a cloud model. For your own models, a price of your own (for example what the hardware costs you per million tokens) lets you compare and charge back internal use; leave it empty if you do not need that.
Requests to an external model without a price are still counted. Spend this month on the dashboard says how many there were ("Requests without a price"), so you know the estimate is short.
Usage per person and per group
- Per person: Top Users on the cost pages, and the User ID filter under Requests.
- Per group: each request is recorded with the person's Usage group, the group set on their row under Access Control → Users (see Users, groups and roles). A person with no usage group counts towards none. Reports of usage per group in the console are Planned.
Limits and budgets
Budgets and limits per person, group or agent are Planned: they will cap how much a person, a team or an agent may use.
When it does not work
The figures are empty. No requests in the range, or the gateway cannot write its log. Send a message in the chat, then refresh.
Spend shows "None" or looks too low. The models used have no price. Set them as above.
A request is missing from the cost pages. Only requests that reach the gateway are counted: a model someone calls directly at its endpoint, bypassing Fadenstack, is not.